Ribeiro J. S., Salva T. J. G., Tomaziello R. A., Augusto F., Ferreira M. M. C., "DISCRIMINATION OF BRAZILIAN ARABICA COFFEE ACCORDING TO OVERALL QUALITY USING AROMA COMPOSITION, SOLID PHASE MICROEXTRACTION (SPME) AND PARTIAL LEAST SQUARES - DISCRIMINANT ANALYSIS (PLS-DA)". Campinas, SP, Brazil, 14-19/09/2008: 22nd International Conference of Coffee Science, Programme & Abstracts (2008) 131. Poster PC767.
|
|
RIBEIRO, Juliano S.*, SALVA, Terezinha J. G**, TOMAZIELLO, Roberto A.**, AUGUSTO, F.* and FERREIRA, Márcia M. C*
*Universidade Estadual de Campinas, SP, Brazil, **Instituto Agronômico de Campinas, SP, Brazil.
Flavor plays an important
role in sensory analyses and could be considered a fingerprint
of products [1]. The flavor of
coffee is composed of
an extremely complex mixture of volatile
compounds that presents different concentrations and
intensities.
Each functional class found i n roasted coffee flavor shows different
compounds and derivatives with distinct
sensorial attributes and
odorific impact. In order to get insight into which peaks
of gas chromatographic analysis could be
responsible for the discrimination
of the Arabica coffee samples according to their overall quality,
eleven samples with high
overall quality (class one),
and 9 samples with low overall quality (class two) have been investigated.
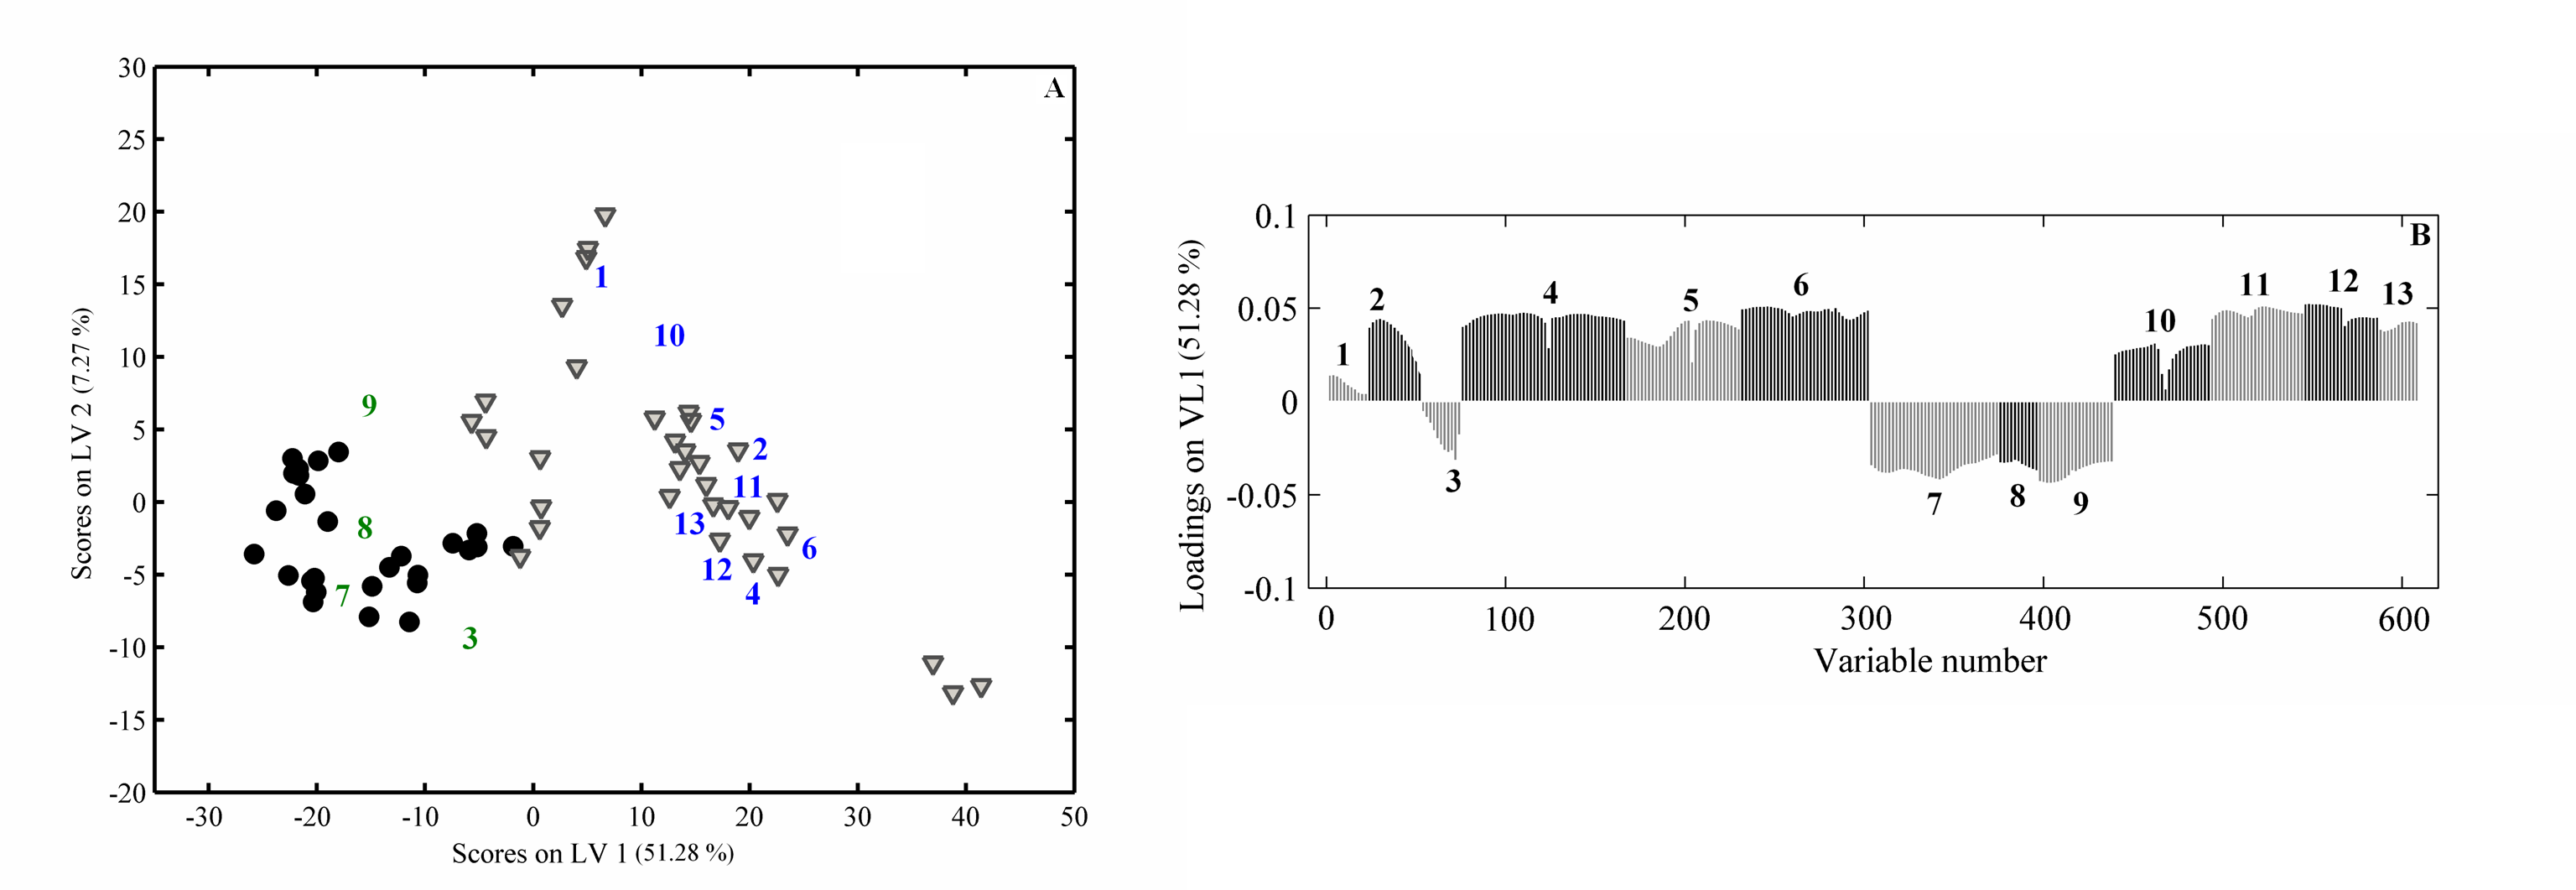
Partial least squares-discriminant
analysis (PLS-DA) [2] was applied to the pre-selected
peaks and, from the scores plot
shown in Figure
1A, two distinct groups can be visualized. Coffee samples
with low overall quality are located on the left
side, with negative scores
in LV1 (51.28 % of the original information), well separated from samples
with high overall quality
on the right side, with
positive scores.
Figure 1 Scores (A) and
Loadings (B) plots. Low (circles) and high (triangles)
overall quality samples. The numbers in
figure A and B are the peaks
responsible for the discrimination
From the loadings
plot of LV1 (Figure 1B) it can be seen
that the higher the concentration of
3-methypropanal (1),
2-methylfuran (2),
furfural (4), furfuryl formate (5), 5-methyl-2-furancarboxaldehyde
(6) and 4-ethylguaiacol (13) the higher
the quality
of the arabica coffee. On the
other hand, 3-methylthiophen
(3), 2-furanmethanol acetate
(7) and
2-ethyl-3,6-dimethylpyrazine
(9) tend to be more concentrated in worst beverages. The not yet identified
compounds (8, 10,
11 and 12) are undergoing
new mass spectrometry analyses.
[1] Cuevas-Glory, L. F., Pino, J. A., Santiago, L., Sauri-Duch, E., Food Chem., 103,1032 (2007);
[2] Barker, M., Rayens, W.,
J. Chemom., 17, 166 (2003);
131