Ribeiro J. S., Teófilo R. F., Augusto F., Ferreira M. M. C., "SIMULTANEOUS MULTIPLE RESPONSE OPTIMIZATION OF MICROEXTRACTION CONDITIONS USING PRINCIPAL COMPONENT ANALYSIS AND RESPONSE SURFACE METHODOLOGY TO COFFEE VOLATILE EXTRACTION". Campinas, SP, Brazil, 14-19/09/2008: 22nd International Conference of Coffee Science, Programme & Abstracts (2008) 132. Poster PC768.
|
|
RIBEIRO, Juliano S.*, TEÓFILO, Reinaldo, F.*, AUGUSTO, F.*, FERREIRA, Márcia M. C*
*Universidade Estadual de Campinas, SP, Brazil
Principal component analysis
(PCA) [1] and response surface methodology (RSM) [2] were applied to simultaneous
multiple
responses optimization
(MRO) of the headspace-solid-phase microextraction
(HS-SPME) conditions to extract volatile
compounds from roasted arabica
coffee. In a greater number of situations,
some or all chromatographic peaks present
relatively high correlation.
This fact is a great advantage in MRO analysis
because the correlated responses provide
redundant information.
The initial responses were 57 peak areas obtained from
gas chromatographic system with flame
ionization detector (GC-FID).
The basis of
MRO consists in compact several correlated peak
areas in one component through PCA and uses
this
component as response in
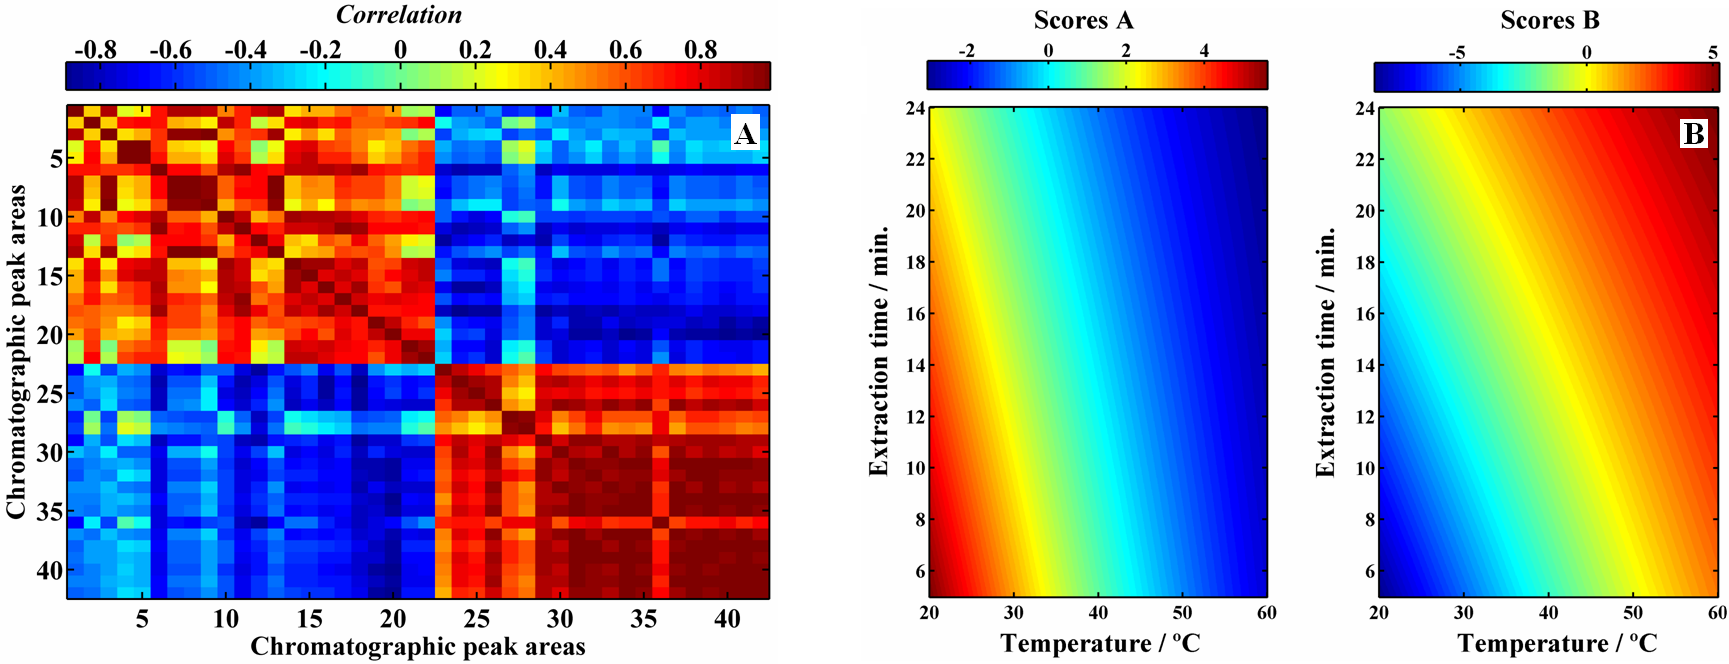
the central composite design (CCD). Through a correlogram map
(Figure 1A), it was observed
direct correlations among
peak areas in two subsets (in red). Negative correlations were observed
among peak areas of the
two subsets (in blue),
which means that the responses of one subset brings different
chemical information than the other.
Hence, the multiple
response analyses using PCA were performed separately
for each subset, in order to obtain higher
explained variance in PC1.
The first components of the two subsets explained 64.51
and 81.98 % of the data variance,
respectively. ANOVA indicated
that both regression models are significant (p < 0.05) and
lack-of-fit are not significant (p >
0.05). The response surfaces
using the PC1 scores of the subsets are indicated in Figure 1B.
Figure 1 - Correlation map
of peak areas (A) and response surfaces for the two subset scores (B)
The new approach introduced
in this work using PCA and RSM is a versatile and
interpretable procedure to optimize the
extraction of desired volatile
compounds in coffee samples.
[1] Ferreira, M. M. C., Antunes, A. M., Melgo, M. S., Volpe, P. L., Quím. Nova, 22, 724 (1999);
[2] Teófilo, R. F.,
Ferreira, M. M. C., Quim. Nova, 29, 338 (2006);
132