Barbosa E. G., Martins J. P. A., Pasqualoto K. F. M., Ferreira M. M. C., "LQTAgrid: an open source package to generate 4D-QSAR descriptors". Porto de Galinhas, PE, Brazil, 09-13/11/2008: The 4th Brazilian Symposium on Medicinal Chemistry (BrazMedChem2008): Systems Chemical Biology, CD-ROM Online, (2008) No. 171. Poster R0348-1.
Brazilian Chemical Society (SBQ). Division of Medicinal Chemistry. 4th Brazilian Symposium on Medicinal Chemistry
LQTAgrid: an open source package to generate 4D-QSAR descriptors
Barbosa, E.G.; Martins, J.P.A.; Pasqualoto, K. F. M.; Ferreira, M. M. C. - jpmartins@iqm.unicamp.br
Laboratório de Quimiometria Teórica e Aplicada - LQTA, Instituto de Química, UNICAMP, Campinas-SP, Brasil
Keywords: Molecular Dynamics,
4D-QSAR, Gromacs, LQTAgrid.
Introduction
3D-QSAR formalisms, such
as comparative molecular field analysis (CoMFA),1
use a set of compounds to generate 3D descriptors for building partial
least squares (PLS) models, and provide relevant information for developing
ligand-based drug design. Hopfinger and co-workers2
reported an independent-receptor (IR) methodology where multiple
conformations of each ligand obtained from molecular dynamics (MD) simulations
are considered in the construction of IR 3D-QSAR models. Aiming to combine
the advantages of both methods, CoMFA and IR 4D-QSAR, an open source
package of programs was developed, named LQTAgrid.
Initially, the open source
program GROMACS3 is employed to create
a conformational profile (CP) of each ligand in the training set, from
MD simulations having explicit solvent. Then, the CP of the ligands are
aligned in a 3D virtual box or grid and the van der Waals and electrostatic
energy contributions are calculated, using probes, to generate the 4D-QSAR
descriptors matrix (LQTAgrid program). The construction of multivariate
QSAR models can be performed according to the user's software preferences.
Results and Discussion
To validate the methodology
proposed, the following two sets considering distinct classes were chosen:
44 inhibitors of p38 kinase4 (set 1)
and 47 glucose analogue inhibitors of glycogen phosphorylase5
(set 2).
A previous variable selection
was carried out, using the Pirouette package and the OPS algorithm6,
which was developed in our research group. Reasonable QSAR models employing
PLS and leave-one-out crossvalidation were obtained. The best QSAR
model generated with set 1 presented the following statistical parameters
values: q2 = 0.70; r2
= 0.83; and, standard error of calibration (SEC) of 0.26 and standard error
of validation (SEV) of 0.30, with 3 latent variables (LV), which were statistically
more significant than the values reported in ref. 4 [q2
= 0.55; r2 = 0.91; SEC = 0.19].
The values of q2 and r2
reported in ref. 4 are indicative of overffiting. Regarding set 2,
the best QSAR model presented the values of statistical measures comparable
to those from the original paper. LQTAgrid (q2
= 0.76; r2 = 0.80); ref. 5 (q2
= 0.83 and r2 = 0.87), SEV was 0.63
using 5 LV. Those QSAR models were validated applying Y-randomization and
leave-N-out
(N = 1 to 10) methodologies.
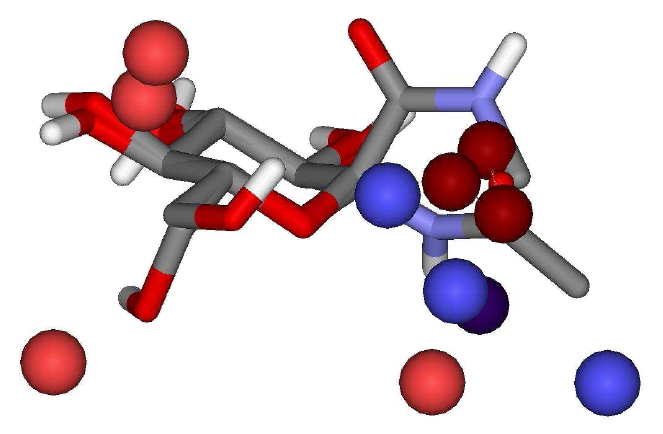
The descriptors selected
in the best QSAR models can be graphically visualized (hot spots) in Figure
1. Favorable and unfavorable energy contributions (electrostatic and
van der Waals) to the biological activity are defined based on the sign
of the PLS regression coefficients. Those contributions correspond to possible
ligand-receptor interactions, as well as favorable ligand occupations (places
for adding functional groups that would increase the biological activity,
for example). Figure 1 shows the graphical visualization of the 4D descriptors
selected in the best QSAR model for a ligand from set 2.
Figure 1. Descriptors
graphical representation considering the best QSAR model (set 2)
Conclusions
The methodology presented
generates 4D descriptors, which after a variable selection, provide reliable
and robust QSAR models. The collaborative license of the open source LQTAgrid
program will allow its use for the construction of descriptor matrices
in 4D-QSAR analyses.
Acknowledgements
The authors are grateful
to CAPES, FAPESP and CNPq for the financial support.
1 Cramer, R.D.; Patterson, D.E.;
Bunce J.D. J. Am. Chem. Soc. 1988, 110, 5959;
2 Albuquerque M.G.; Hopfinger,
A.J.; Barreiro E. J.; de Alencastro R. B. J. Chem. Inf. Model. 1997,
38, 925;
3 Christen, M.; Hunenberger,
P. H.; Bakowies, D.; Baron, R.; Burgi, R.; Geerke, D. P.; Heinz, T. N.;
Kastenholz, M. A.; Krautler, V.; Oostenbrink, C.; Peter, C.; Trzesniak
D. J. Comput. Chem. 2005, 26, 1719;
4 Ravindra, G.K.; Achaiah,
G.; Sastry, G.N. Euro. J. Med. Chem. 2008, 43, 830.;
5 Venkatarangan, P.; Hopfinger,
A. J. Chem. Inf. Comput. Sci. 1999, 39, 1141.
6 Teófilo, R.F.; Martins,
J.P.A.; Ferreira, M.M.C. J. Chem. 2008, xx.
4th Brazilian Symposium on Medicinal Chemistry - BrazMedChem2008