Ribeiro J. S., Salva T., Ferreira, M. M. C., "Exploratory data analysis of commercial coffees with different roasted degrees and process using diffuse reflection mid-infrared spectroscopy". Águas de Lindóia, SP, Brazil, 10-15/09/2006: 10th International Conference on Chemometrics in Analytical Chemistry (CAC-2006, CAC-X), Book of Abstracts (2006) P028. Poster 028.
10th International Conference on Chemometrics in Analytical Chemistry P028
Exploratory data analysis
of commercial coffees with different
roasted degrees and process
using diffuse reflection mid-
infrared spectroscopy
Ribeiro, J. S.1,2*, Salva, T.2 and Ferreira, M. M. C1 jribeiro@iqm.unicamp.br
1. Universidade Estadual
de Campinas - UNICAMP - Campinas - SP - Brazil;
2. Instituto Agronômico
de Campinas - IAC - Campinas - SP - Brazil;
Keywords: Roosted Coffee,
mid-infrared and chemometrics
_____________________________________________________________________________________
Coffee
is one of the most popular drinks around the world. Strategies used to
authenticate certain of its
characteristics
have been traditionally relied on wet
chemistry. These methods, however, are
time-
consuming and expensive,
and consequently, demand for rapid and
inexpensive controls is growing.
Infrared spectroscopy
is regarded as a quick and reliable mean of
investigating food quality and safety.
The main
advantages of mid-infrared (MIR) spectroscopy include
its speed of analysis and potential
selectivity,
when coupled to chemometric data analysis techniques.
Despite
the amount of research conducted to classify varieties
of the same food product, there is no
published work applying
mid-infrared spectroscopy to discriminate different
roasted degrees of coffee
samples.
In the
present work, Brazilian commercial coffees
of different roasting degrees were analyzed
by
diffuse reflectance
mid-infrared spectroscopy.
Samples.
Twenty one samples of Brazilian commercial coffee were
analyzed in triplicates (7 of them
medium roasting and decaffeinated;
7 of normal roasting; and the remainder of extra roasting
all from
different production batches).
Data
acquisition. MIR spectra of
each solid sample were recorded
at room temperature and
transformed to
absorbance units with a background
spectrum of ground KBr. Each spectrum
was
obtained by scanning the
400 4000 cm-1 region 256
times at a nominal resolution of 4 cm-1.
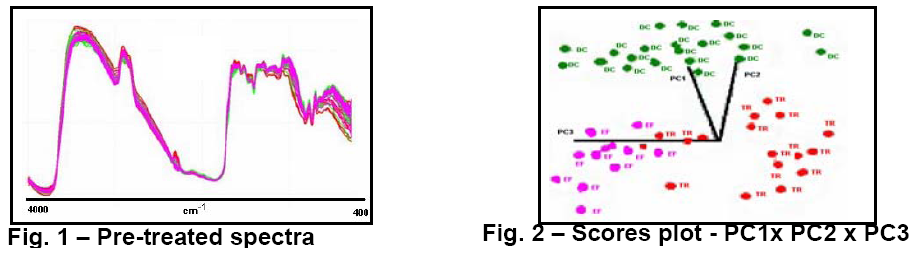
Spectral
data were smoothed
by a moving average filter with a window size n
= 25, followed by a multiplicative
signal correction (MSC).
Principal Component analysis of meancentered pre-treated
data (Fig. 1) was
carried out with Pirouette
3.11 chemometrics software.
Variable
selection was performed to remove those regions
of low discriminating and modeling power.
Therefore, the spectral
regions 4000 3500, 2500 2300 and 100 - 400
cm-1 were excluded from data
set.
Principal
component analysis was applied to
the selected variables. PC1xPC2xPC3 scores
plot
describing 84.92 % of the
total variance (Fig. 2) shows that three clusters of coffee could
be distinguished
as follows: the upper group
of decaffeinated coffee (green color) is clearly discriminated
from the other
two probably due to the
roasting and caffeine extraction processes. The other two groups
at the bottom of
the plot correspond to the
other roasting processes - traditional (red color) and extra roasting
(violet).
This
exploratory data analysis clearly shows that diffuse reflectance mid-infrared
spectroscopy coupled
to chemometrics has potential
advantages to differentiate among commercial coffee samples
of various
roasting degrees.
Acknowledgment. Capes,
FAPESP and Agronomic Institute of Campinas
_____________________________________________________________________________________