21.
Porto M. E. G., Ferreira M. M. C., "A Utilização do
Software Mathematica na Representação Gráfica do Átomo
de Hidrogênio" ["Use of Software Mathematica In Graphical
Representation of the Hydrogen Atom"]. Caxambu, MG, 25-29/05/1993:
16a
Reunião Anual da Sociedade Brasileira de Química [16th Annual
Meeting of the Brazilian Chemical Society], Livro de Resumos [Book
of Abstracts], (1993) IC-04. Poster IC-04.
Português
IC-04
A UTILIZAÇÃO DO SOFTWARE
MATHEMATICA NA REPRESENTAÇÃO GRAFICA DO ÁTOMO DE
HIDROGÊNIO. MariaEugeniaG.
Porto (IC) e Márcia M.C.Ferreira
(PQ) -
Departamento de Físico Química
- Instituto de Química da UNICAMP -
Campinas - SP.
Para representar
graficamente através do método cartesiano funções
de
três variáveis
independentes, como por exemplo a função
de onda de um
átomo de Hidrogênio,
seriam necessárias quatro dimensões,
o que é
obviamente impossível.
Neste trabalho apresentamos algumas alternativas
para o estudo gráfico destas
funções.
Uma das maneiras consiste
em fixar o valor de uma das variáveis, o que
possibilita visualizar cortes dos
orbitais atômicos através de curvas ou
linhas de contorno, gráficos
de densidade e superfícies em três dimensões.
Tais gráficos são facilmente
gerados utilizando o software MATHEMATICA.
Sendo o MATHEMATICA um
software de alto nível, todos estes gráficos
(e
outros) podem ser
obtidos por simples comandos, sem necessidade
de
programação. Como
não é requerido do usuário o conhecimento
de qualquer
linguagem computacional, a
sua utilização como um instrumento didático
torna-se acessível para
qualquer estudante.
Uma segunda alternativa,
utiliza o artifício de representar o valor da
função atribuindo-lhe
uma cor do espectro, de acordo com uma escala
numérica contínua,
com a extremidade inferior no vermelho e superior no
violeta. Escrevendo-se uma pequena
rotina, gera-se os pontos x, y e z
aleatoriamente, calcula-se o valor
da função nestes pontos e de acordo com
este valor, atribui-se uma cor
a cada ponto.
O efeito visual de
todos estes gráficos é atraente e
revela de uma
forma global uma grande quantidade
de informações. CNPq
English
IC-04
USE OF SOFTWARE MATHEMATICA IN GRAPHICAL
REPRESENTATION OF THE HYDROGEN
ATOM. MariaEugeniaG.
Porto (IC) e Márcia M.C.Ferreira
(PQ) -
Departamento de Físico Química
- Instituto de Química da UNICAMP -
Campinas - SP.
Four dimensions are necessary
for graphical representation of a fun-
ction of four three variables, as
for example the hydrogen atom's wave-
function, what is simply impossible.
In this work, some alternatives to
the graphical study of such functions,
are presented.
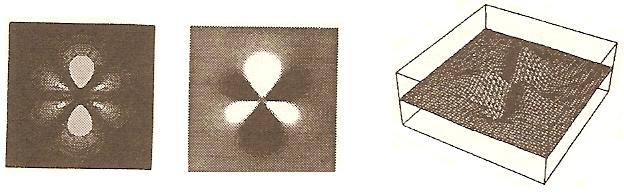
An alternative consists
of fixing the value of a variable, what makes
possible to visualize the cross-sections
of the atomic orbitals in the
form of contour lines or curves,
and the density graphs in the form of
three-dimensional surfaces. Such graphs
can be generated easily by means
of the software MATHEMATICA.
As MATHEMATICA is a high-level software,
all the graphs (and also others) can
be obtained by simple commands and
with no computer programming. MATHEMATICA
does not require any knowledge
of computer programming, thus its
usage as a didactical instrument beco-
mes friendly to any student.
Another alternative uses
tricks to represent a value of a function by
attributing a color of
the spectrum to this value, using a continuous
numerical scale, and red and violet
colors for the bottom and top extre-
mes, respectively. By typing
a little routine, points with coordinates
x, y, and z are generated,
the values of the function at these points
are calculated, and color is
attributed to each point.
The visual effect
of all these graphs is very attractive and shows
generally a large quantity of
information. CNPq